Mysteries from past developers — a frequent story about cost and performance problems
One day, speaking with one customer, a topic arose that no matter who client is, it eventually comes up:
- Why are our systems running slower than before? We haven’t changed a thing!
- Is there something we can do to stop snowballing and optimize cost as well as improve performance?
Sometimes issues are seen at a simple glance, and sometimes they’re quite difficult or are thought to be impossible since too many people already looked into it and there was no simple explanation rather than “you’re running a monolith”, or “technical debt”. That was the de-facto answer until I met Datadog, APM and its Profiler.
Today I’m going to show you one very clear use case of how the APM+Profiler combo can pinpoint you to the single line causing an issue that you didn’t even expect to be the actual problem. A single function that was so unoptimized it actually made a whole multinational store experience a ~50% drop in latencies when it got fixed
This particular client is running a quite customized Magento store with a lot of plugins, which doesn’t seem like anything out of the ordinary. They have millions of products, which they have recently made changes to inventories and now Google is requesting almost 20 thousand uncached product requests per hour as a sustained load for a few days — soon to be weeks. Google Search crawler and Google merchant were hitting really hard. The infrastructure had to be scaled considerably to withstand that traffic spike, and something had to be done to improve performance as well as not being permanently overscaled and paying extra until Google finished its crawling.
So, what’s next? We already knew what Google was doing thanks to all the nginx logs being exported: the products page had to be checked out (pun intended).
Here’s what a normal product trace looked like (without the database queries or they get really noisy), with the p50 around 3.8s (you can see that the current screenshot is equivalent to a p71):

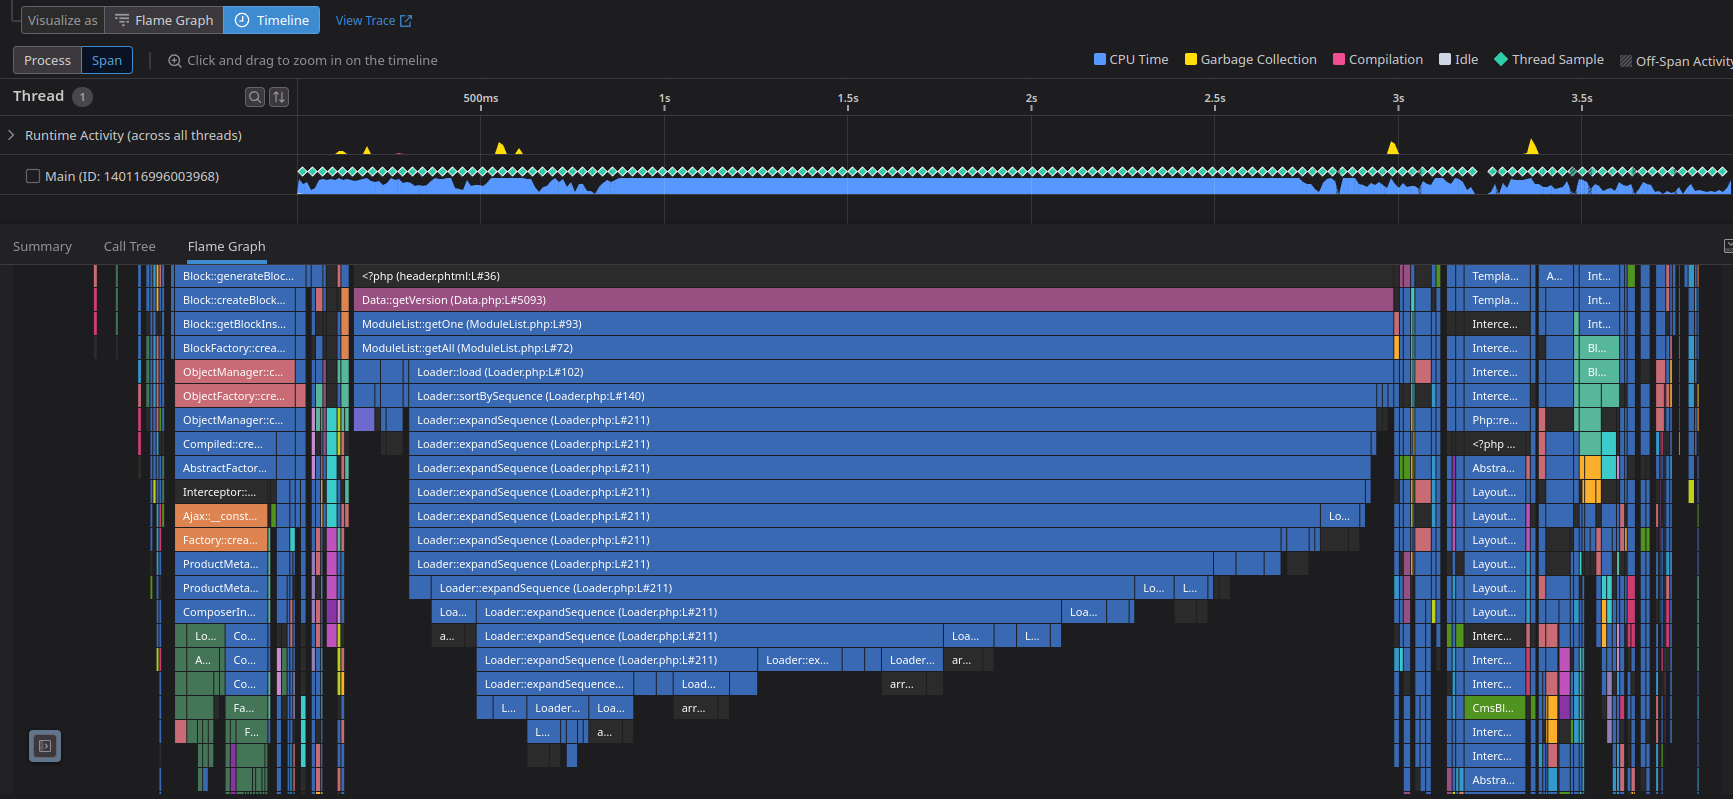
That header template being built looks really suspicious. It shouldn’t take that long, and the CPU usage is clearly stuck at 100% during that function. What can the profiler do for me, here? I already see that the header is the problem! — Or is it? — With a click on the “Open in Profiling” I can hop into a more detailed explanation of that specific request on what functions, namespaces, libraries… the code executed during that time - with zero custom instrumentation needed.

There’s clearly a loop, a really big loop, doing something that the best of us would guess that could be improved easily. And remember, now we can see the individual lines that triggered everything (which it still blows my mind).
It turned out to be a simple check that was done on every plugin installed on that site until a specific plugin and version was found — which would’ve caused more and more issues as the site scaled. The check was changed for a simple query to the database asking to the right thing instead of scraping all the plugins.
All of that build-up just for that?
Here comes the great part. This is the header. This did not just only improve the product page, but the whole site.
This is the current fixed flame graph for the same catalog/product/view

The arrows show the same header part being selected. Yes, code does the exact same thing. And we’ve lowered the request time to a p50 of 1.9s!
Here you can see the drastic p95 difference on the three main endpoints: the products, categories, and searches (please, ignore the search indexes being rebuilt overnight).


And this is how the internal PHP profiler metrics look:

The gray lines represent the same point in time, days prior and the following day. This shows a clear decline in memory allocation as well as CPU usage, freeing resources literally in half and allowing for double bandwidth within the same infrastructure capacity and saving up a good chunk of the AWS bill (not taking in account the databases, but you get the memo).
The Datadog APM+Profiler integration within PHP as well as other languages is a simple on/off flag. The effort is minimal, and it provides clear visibility on how your resources are being utilized, helping you improve performance, reduce cost, improving stability, SEO and overall user experience.
What are you waiting for?
Sign up today and let them know you saw this post.
To add context for those who don’t know me, I work as an Independent Consultant for IT services. My main focus is DevOps/SRE, and my beloved friend and swiss knife is Datadog, who proudly named me as one of their Ambassadors. I help companies implement scalable and reliable systems as well as adopting the Observability culture. Feel free to contact me if these things sound great for your company!